

A Gentle Dive Into Data Science
Data science for a non-technical audience, the data science project lifecycle, and tools data scientists use in their day-to-day work.

To the Reader
Maybe you come from a background in humanities.
Maybe you never do experiments, hate looking at numbers, and computers scare you a bit.
Perhaps you’ve conducted experiments involving quantitative data analysis and you’re an R aficionado.
You might be used to experimentation only for academic research purposes, and haven’t taken that extra step to apply your research skills to a business setting.
Maybe you’re a complete and total beginner.
That’s how I felt when I graduated with a BA in Spanish and considered venturing into data science and NLP.
If that’s true for you, I want you to know that it is completely okay. Don’t worry, this Deep Dive is actually made just for you!
This post aims to provide you with a gentle introduction to data science, the data science project workflow, and some tools that data scientists use in their work.
What is Data Science?
Data science is an interdisciplinary field at the intersection of computer science, statistics, and domain-specific knowledge that aims to provide insightful analyses and interpretations of structured or unstructured data.
One goal of data science is to use the information available to us to make data-informed decisions.
In a business setting, this translates into increased efficiency or increased revenue. Data science has a wide range of applications in industry. Let’s take a look at some of them.
Applications of Data Science
Data science is all around us! Here are some easy-to-digest examples.
Customer Churn: Telecom companies analyze call, text, and data usage patterns to identify customers likely to switch to another provider or end their subscriptions.
Predicting Maintenance for Work Vehicles: Logistics companies use predictive models to determine when a truck is likely to require maintenance, which helps them save time (and in turn, money).
Personalized Marketing and Recommendations: E-commerce platforms make use of browsing and purchase history to recommend products to customers. This is how Amazon always shows up at your door a bit more than you actually might like them to!
The Data Science Project Lifecycle
Data science projects tend to follow a similar set of phases. The CRoss Industry Standard Process for Data Mining (CRISP-DM) is a methodology that describes the lifecycle of a data science project, from start to finish.
Not every company may follow these steps, and they may not call it CRISP-DM.
I think most data scientists would say that this process is somewhat representative of their workflow.
Let’s walk through each step with an example in mind: customer churn.
Customer churn is when a customer terminates their business with a company. As you can imagine, this is something businesses might want to avoid!

Understanding the Business Problem
Data science projects start with a problem. Sounds great, right?
Jokes aside, one of the goals of a data science project is to improve or remediate a problem. To provide a solution for that problem, it’s important to truly understand it first.
Understanding the problem is arguably the most important part of the process. A robust understanding of the problem at hand is crucial because it informs all the subsequent steps.
If you do not have a strong grasp of what the problem actually is, then your efforts (and those of your team) can be misguided.
This step helps you vet ideas and distinguish problems that are worth solving from features that are nice to have.
Imagine this scenario.
Your team is dead set on adding a new, cool, flashy AI feature to address the customer churn problem. It sounds like a no-brainer.
Fast forward six months, and you see that there has been no improvement in customer churn. Your team is left wondering what went wrong with your solution, and they’re angry that they spent four months building and thinking about this solution.
One method to make sure we are addressing the right problem at the beginning is the “5 Whys” technique. This involves asking “Why?” five times to drill down into the root cause of a problem.
Why is customer churn a concern? Churn reduces our revenue and increases the cost of acquiring new customers.
Why do customers choose to leave? Customers might be dissatisfied with our service or find a better offer elsewhere.
Why are they dissatisfied with our service? Perhaps our customer support response times are slow.
Why are response times slow? It could be due to understaffing or inefficient processes.
Why are our processes inefficient or understaffed? Possibly because of budget constraints or a lack of strategic focus on customer service.
We realize the issue might be the inefficiency in our customer service processes rather than just the surface-level symptom of customer churn.
We still need to dig into the data to find out, but at least we didn’t head down the wrong path for six months, misguide our team, and waste time and resources. This is where understanding our data comes into play.
Understanding the Data
Before diving into any specific analyses or modeling, it’s crucial to thoroughly understand the data with which we’ll be working. This step sets the stage for all subsequent analysis.
This step typically involves:
collecting or loading your data
exploring and visualizing it
ensuring that it meets the requirements of the business problem
Key Questions to Keep in Mind
What data could be used to solve this problem?
Think about this in terms of the actual problem itself. What information might be helpful in accomplishing this task?
Then, think about what data you might have.
For instance, if you're investigating why customers chose not to renew their contracts this year, consider the factors that could influence that decision.
What behavior might a churned customer portray in the months leading up to the termination of their contract?
What are the breadcrumbs that they’ve left behind?
Now, think about the data you have access to.
Where can I get that data?
Maybe you have to collect or load that data. More often than not, you have to pull from various database tables to construct your own dataset.
This sounds a bit scary, at least, it did to me when I first started. Don’t worry, we’ll cover how to pull data from databases in a future post.
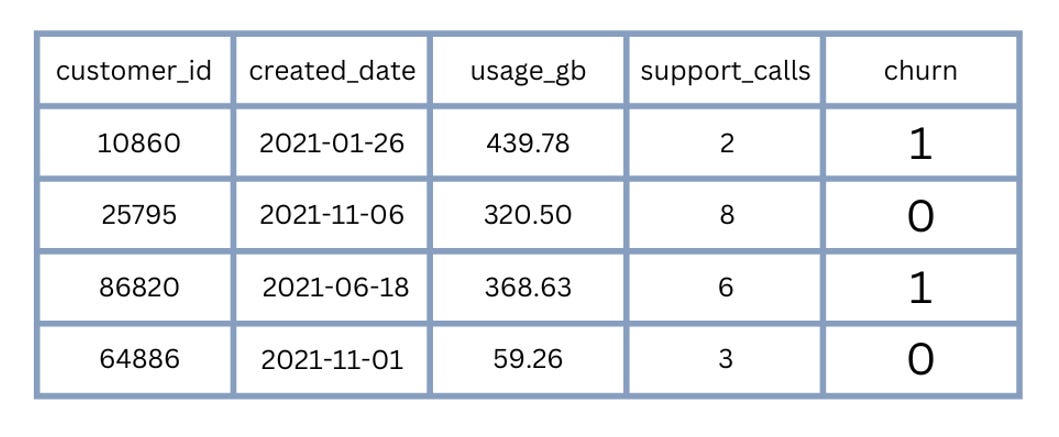
What does each variable in our dataset represent?
Imagine a table in your head.
What do the rows represent? What do the columns represent?
In the context of customer churn, each row might be a company, or a singular user. Each column might contain some information about that customer, such as the length of time the customer has been with a company, frequency of customer support contacts, or demographic information.
Challenge for the reader: What are other variables that might be useful in understanding customer churn?
Does my data even look right?
You should be asking this question at every step of the way. It’s easy to pull data from a database. It’s even easier to make an error while doing so.
What I mean here is not whether the data fits my hypothesis about why customers might churn.
What I really mean is…
Did a customer really have 150 support calls in one month?
Did a customer really sign up on October 2, 2041?
Did a customer really cancel their subscription 240 years in the past?
If the answer to any of those questions is a yes, then either you’re serving a time-traveling client with exceptional support needs, or it’s likely that there’s an error in your code somewhere!
Preparing the Data
This is a crucial step in the process that often dictates the performance of the modeling step. There is a well-known saying: “garbage in, garbage out.” The output of your model will depend on the quality of the data on which it was trained!
Poor quality data = misleading results = poor decision-making.
The data preparation phase often includes steps like:
Selecting the data we want to use
Cleaning the data
Handling missing values
Creating new variables that can be used for prediction or analysis
You might be thinking: Uh, I have no idea how to do any of that.
Rest assured, you’re not alone. Everyone starts somewhere. We’ll cover this process in future posts.
Challenge for the reader
In the context of customer churn analysis, maybe you have the dates that customers started their subscriptions and ended them (if applicable). How might you use these dates to create another variable? Think about what this might mean in terms of the customer’s behavior.
Modeling
So what is modeling?
We can describe a model as a simplified representation of the real, complex world created using the data we have available to us. At the end of the day, the goal is to create a model that best captures the underlying patterns and relationships in the data, so that we can effectively address our business problem.
Consider this scenario.
We begin by identifying not just one, but several behaviors associated with churn, such as the frequency of customer service contacts, the nature of these contacts (complaints vs. inquiries), customer engagement with our emails or apps, and overall usage patterns of our services.
Suppose our data shows that customers who contact customer service frequently about issues, rarely engage with promotional emails, and show declining usage of the service over time are more likely to cancel their subscriptions.
Now, let’s say we observe a customer exhibiting all these behaviors. Our model, recognizing this pattern, would predict a high likelihood of churn for this customer. Now, we have also learned something about customer churn at our fictional business. This is the intuition behind the modeling stage.
There are many ways to model our data, ranging from linear equations to more complex machine learning algorithms, each with their own advantages and disadvantages.
Model selection is a can of worms for another day, but some factors to consider are:
Suitability for the business problem
Trade-off between accuracy and interpretability
Computational efficiency
More food for thought about model selection:
What if you could identify 90% of the people that might cancel their subscription, but you had no idea which factors might contribute to that?
What if you could only identify 85% of these customers, but you could obtain a ranked list of factors that are associated with those who renew versus those who cancel?
The right choice heavily depends on your specific business context.
In order for any of this to even matter, we need to know how well our model performs!
Evaluation
So, we’ve shown our model a selection of data that we have available to us. But how does it perform on data it has never seen before?
Consider this example: I’m teaching you to distinguish between customers who have canceled their subscriptions and those who have renewed. If I only use the same 10 examples repeatedly, you might simply memorize their characteristics instead of truly understanding the underlying patterns that distinguish them.
Now, let’s say I introduce you to a fresh group of customers with similar characteristics that you’ve never seen before.
Your ability to identify which of these new customers are likely to cancel or renew their subscription will show us how well you’ve learned the underlying patterns, not just memorized examples.
This is the intuition behind the evaluation stage!
Question to keep in mind:
Does our model mistakenly identify customers who have churned as renewal customers, or customers who have renewed as churned customers?
Which is more of a priority, never falsely identifying a customer as likely to cancel their subscription, or never missing a customer that is truly likely to cancel?
Are there similarities among the customers that our model fails to correctly identify as likely or unlikely to cancel?
Once we have done our due diligence, we can deploy our model, if applicable.
Deployment
We may never deploy our model.
Yep, you read that right.
It’s very possible that we only did the previous step so that we could identify factors associated with those who cancel versus those who renew, so we can act on that information.
But what if we did want to deploy it?
Deploying a model means making it available or integrating it into our existing systems to get real-time or batch predictions. It is a way to “serve up” our model.
For customer churn, we might deploy our model in such a way that we can automatically notify customer service reps when a customer is likely to cancel their subscription based on their recent behavior.
Tools of the Trade
A list of tasks and tools we might use for each one.
Data Manipulation and Analysis: Python (with libraries like pandas, NumPy, scikit-learn, statsmodels), R
Database Management: SQL, NoSQL
Data Visualization: Tableau, PowerBI, matplotlib, seaborn
Model Deployment: Docker, Flask, AWS, Azure
This list can look extremely overwhelming. Even if you have a background in data science, it can look a bit scary!
What? You’re telling me I have to master 16 tools to do a data science project?
Nope! Not even close. Most projects might involve 3-4 of those tools at a time.
Remember, these are just tools to help us achieve business objectives. They aren’t the end all be all.
Learning them is beneficial (especially for interviews), but the big picture thinking is what makes knowledge of these tools even more powerful.
Closing Thoughts
Diving into a new field can be daunting. It can be a bit mind-bending. We covered a lot of ground in this post. Kudos for making it to the end!
I hope this Deep Dive has served as a useful introduction into the world of data science and the steps involved in many data science projects.
Have any questions? Want to suggest a topic for the newsletter? Want to provide feedback?
Respond to this email or leave a comment on this post!
Thank you for reading!
Resource Roundup: More on RCA, Data Preparation, and CRISP-DM
Want to learn more? I’ve handpicked this collection of resources to help you dig deeper on the topic. Let me know what you think!